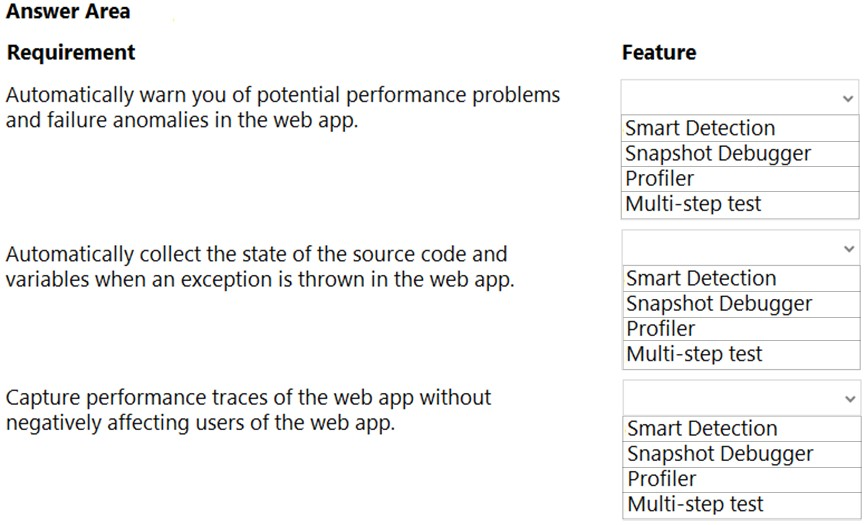
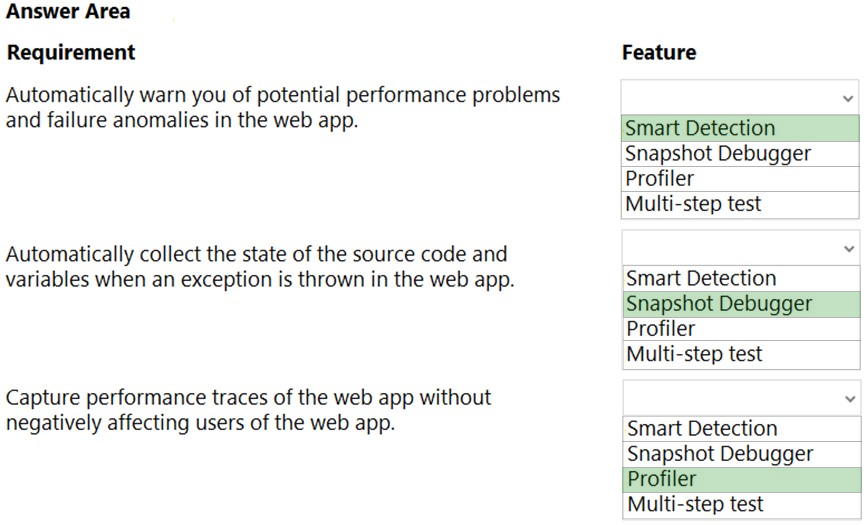
Box 1: Smart Detection -
Smart detection automatically warns you of potential performance problems and failure anomalies in your web application. It performs proactive analysis of the telemetry that your app sends to Application Insights. If there is a sudden rise in failure rates, or abnormal patterns in client or server performance, you get an alert. This feature needs no configuration. It operates if your application sends enough telemetry.
Box 2: Snapshot Debugger -
When an exception occurs, you can automatically collect a debug snapshot from your live web application. The snapshot shows the state of source code and variables at the moment the exception was thrown. The Snapshot Debugger in Azure Application Insights monitors exception telemetry from your web app. It collects snapshots on your top-throwing exceptions so that you have the information you need to diagnose issues in production.
Box 3: Profiler -
Azure Application Insights Profiler provides performance traces for applications running in production in Azure. Profiler:
Captures the data automatically at scale without negatively affecting your users.
Helps you identify the "hot" code path spending the most time handling a particular web request.
Reference:
https://docs.microsoft.com/en-us/azure/azure-monitor/app/proactive-diagnostics
https://docs.microsoft.com/en-us/azure/azure-monitor/snapshot-debugger/snapshot-debugger
https://docs.microsoft.com/en-us/azure/azure-monitor/profiler/profiler-overview