Live Metrics Stream -
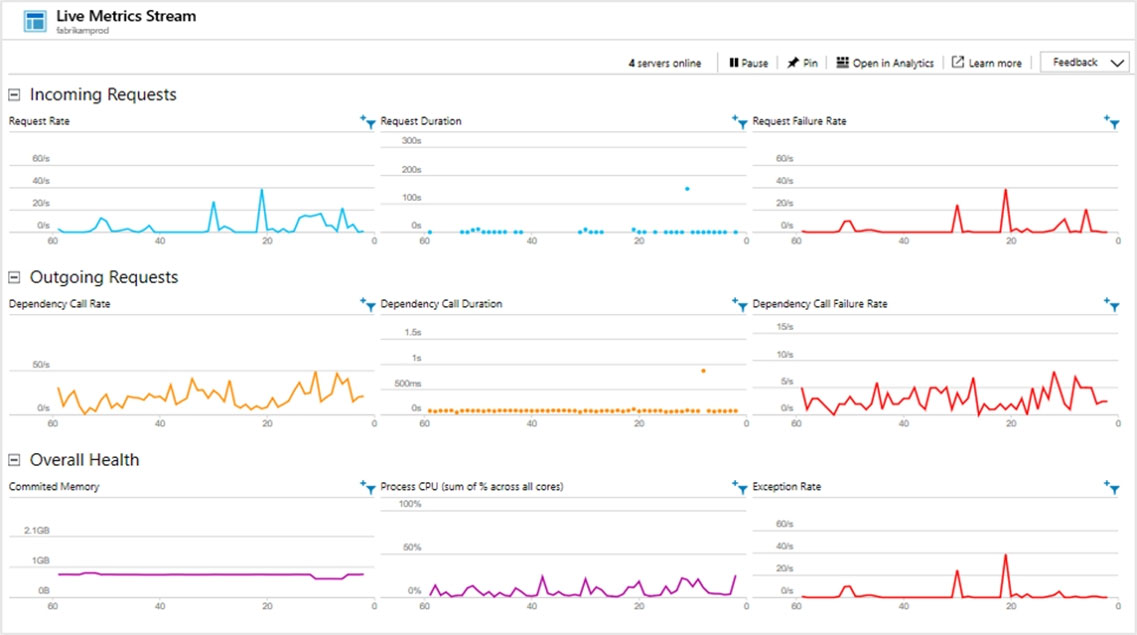
Deploying the latest build can be an anxious experience. If there are any problems, you want to know about them right away, so that you can back out if necessary. Live Metrics Stream gives you key metrics with a latency of about one second.
With Live Metrics Stream, you can:
* Validate a fix while it's released, by watching performance and failure counts.
* Etc.
Incorrect:
* Profiler
Azure Application Insights Profiler provides performance traces for applications running in production in Azure. Profiler:
Captures the data automatically at scale without negatively affecting your users.
Helps you identify the "hot" code path spending the most time handling a particular web request.
* Snapshot debugger
When an exception occurs, you can automatically collect a debug snapshot from your live web application. The snapshot shows the state of source code and variables at the moment the exception was thrown. The Snapshot Debugger in Azure Application Insights monitors exception telemetry from your web app. It collects snapshots on your top-throwing exceptions so that you have the information you need to diagnose issues in production.
Reference:
https://docs.microsoft.com/en-us/azure/azure-monitor/app/live-stream