Win IT Exam with Last Dumps 2025


Microsoft AZ-400 Exam

Page 6/54
Viewing Questions 51 60 out of 535 Questions
11.11%

Question 51
You use Azure SQL Database Intelligent Insights and Azure Application Insights for monitoring.
You need to write ad-hoc queries against the monitoring data.
Which query language should you use?
A. Kusto Query Language (KQL)
B. PL/pgSQL
C. PL/SQL
D. Transact-SQL
Azure Monitor Logs is based on Azure Data Explorer, and log queries are written using the same Kusto query language (KQL). This is a rich language designed to be easy to read and author, and you should be able to start using it with minimal guidance.
Reference:
https://docs.microsoft.com/en-us/azure/azure-monitor/log-query/log-query-overview

Question 52
Your company creates a web application.
You need to recommend a solution that automatically sends to Microsoft Teams a daily summary of the exceptions that occur in the application.
Which two Azure services should you recommend? Each correct answer presents part of the solution.
NOTE: Each correct selection is worth one point.
A. Azure Logic Apps
B. Azure Pipelines
C. Microsoft Visual Studio App Center
D. Azure DevOps Project
E. Azure Application Insights
E: Exceptions in your live web app are reported by Application Insights.
Note: Periodical reports help keep a team informed on how their business critical services are doing. Developers, DevOps/SRE teams, and their managers can be productive with automated reports reliably delivering insights without requiring everyone to sign in the portal. Such reports can also help identify gradual increases in latencies, load or failure rates that may not trigger any alert rules.
A: You can programmatically query Application Insights data to generate custom reports on a schedule. The following options can help you get started quickly:
- Automate reports with Microsoft Flow
- Automate reports with Logic Apps
Reference:
https://docs.microsoft.com/en-us/azure/azure-monitor/app/asp-net-exceptions
https://docs.microsoft.com/en-us/azure/azure-monitor/app/automate-custom-reports

Question 53
DRAG DROP -
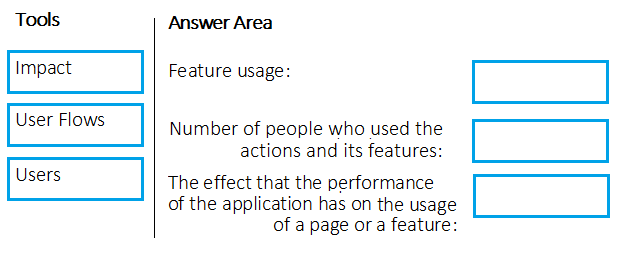
Your company wants to use Azure Application Insights to understand how user behaviors affect an application.
Which Application Insights tool should you use to analyze each behavior? To answer, drag the appropriate tools to the correct behaviors. Each tool may be used once, more than once, or not at all. You may need to drag the split bar between panes or scroll to view content.
NOTE: Each correct selection is worth one point.
Select and Place:
AZ-400_53Q.png related to the Microsoft AZ-400 Exam
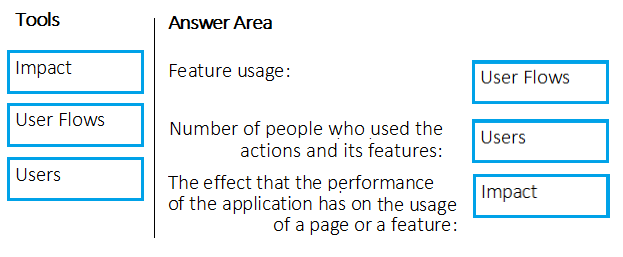
Image AZ-400_53R.png related to the Microsoft AZ-400 Exam
Box 1: User Flows -
The User Flows tool visualizes how users navigate between the pages and features of your site. It's great for answering questions like:
How do users navigate away from a page on your site?
What do users click on a page on your site?
Where are the places that users churn most from your site?
Are there places where users repeat the same action over and over?
Box 2: Users -
Counting Users: The user behavior analytics tools don't currently support counting users or sessions based on properties other than anonymous user ID, authenticated user ID, or session ID.
Box 3: Impact -
Impact analyzes how load times and other properties influence conversion rates for various parts of your app. To put it more precisely, it discovers how any dimension of a page view, custom event, or request affects the usage of a different page view or custom event.
Reference:
https://docs.microsoft.com/en-us/azure/azure-monitor/app/usage-flows
https://docs.microsoft.com/en-us/azure/azure-monitor/app/usage-impact
https://docs.microsoft.com/en-us/azure/azure-monitor/app/usage-troubleshoot

Question 54
Your company is building a mobile app that targets Android and iOS devices.
Your team uses Azure DevOps to manage all work items and release cycles.
You need to recommend a solution to perform the following tasks:
- Collect crash reports for issue analysis.
- Distribute beta releases to your testers.
- Get user feedback on the functionality of new apps.
What should you include in the recommendation?
A. the Microsoft Test & Feedback extension
B. Microsoft Visual Studio App Center integration
C. Azure Application Insights widgets
D. Jenkins integration
The "Exploratory Testing" extension is now "Test & Feedback" and is now Generally Available.
Anyone can now test web apps and give feedback, all directly from the browser on any platform: Windows, Mac, or Linux. Available for Google Chrome and
Mozilla Firefox (required version 50.0 or above) currently. Support for Microsoft Edge is in the pipeline and will be enabled once Edge moves to a Chromium- compatible web platform.
Reference:
https://marketplace.visualstudio.com/items?itemName=ms.vss-exploratorytesting-web

Question 55
You have an Azure DevOps project named Project1 and an Azure subscription named Sub1. Sub1 contains an Azure virtual machine scale set named VMSS1.
VMSS1 hosts a web application named WebApp1. WebApp1 uses stateful sessions.
The WebApp1 installation is managed by using the Custom Script extension. The script resides in an Azure Storage account named sa1.
You plan to make a minor change to a UI element of WebApp1 and to gather user feedback about the change.
You need to implement limited user testing for the new version of WebApp1 on VMSS1.
Which three actions should you perform? Each correct answer presents part of the solution.
NOTE: Each correct selection is worth one point.
A. Modify the load balancer settings of VMSS1.
B. Redeploy VMSS1.
C. Upload a custom script file to sa1.
D. Modify the Custom Script extension settings of VMSS1.
E. Update the configuration of a virtual machine in VMSS1.


Question 56
SIMULATION -
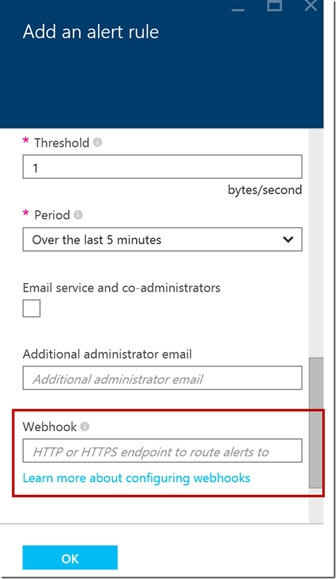
You need to create a notification if the peak average response time of an Azure web app named az400-123456789-main is more than five seconds when evaluated during a five-minute period. The notification must trigger the `https://contoso.com/notify` webhook.
To complete this task, sign in to the Microsoft Azure portal.
1. Open Microsoft Azure Portal
2. Log into your Azure account and go to App Service and look under Monitoring then you will see Alert.
3. Select Add an alert rule
4. Configure the alert rule as per below and click Ok.
Source: Alert on Metrics -
Resource Group: az400-123456789-main
Resource: az400-123456789-main -
Threshold: 5 -
Period: Over the last 5 minutes -
Webhook:
https://contoso.com/notify
AZ-400_56E.jpg related to the Microsoft AZ-400 Exam
Reference:
https://azure.microsoft.com/es-es/blog/webhooks-for-azure-alerts/

Question 57
SIMULATION -
You need to create and configure an Azure Storage account named az400lod11566895stor in a resource group named RG1lod11566895 to store the boot diagnostics for a virtual machine named VM1.
To complete this task, sign in to the Microsoft Azure portal.
Step 1: To create a general-purpose v2 storage account in the Azure portal, follow these steps:
1. On the Azure portal menu, select All services. In the list of resources, type Storage Accounts. As you begin typing, the list filters based on your input. Select
Storage Accounts.
2. On the Storage Accounts window that appears, choose Add.
3. Select the subscription in which to create the storage account.
4. Under the Resource group field, select RG1lod11566895
5. Next, enter a name for your storage account named: az400lod11566895stor
6. Select Create.
Step 2: Enable boot diagnostics on existing virtual machine
To enable Boot diagnostics on an existing virtual machine, follow these steps:
1. Sign in to the Azure portal, and then select the virtual machine VM1.
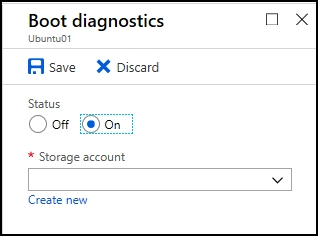
2. In the Support + troubleshooting section, select Boot diagnostics, then select the Settings tab.
3. In Boot diagnostics settings, change the status to On, and from the Storage account drop-down list, select the storage account az400lod11566895stor.
4. Save the change.
AZ-400_57E.png related to the Microsoft AZ-400 Exam
You must restart the virtual machine for the change to take effect.
Reference:
https://docs.microsoft.com/en-us/azure/storage/common/storage-account-create
https://docs.microsoft.com/en-us/azure/virtual-machines/troubleshooting/boot-diagnostics

Question 58
SIMULATION -
You need to create and configure an Azure Storage account named az400lod123456789stor in a resource group named RG1lod123456789 to store the boot diagnostics for a virtual machine named VM1.
To complete this task, sign in to the Microsoft Azure portal.
Step 1: To create a general-purpose v2 storage account in the Azure portal, follow these steps:
1. On the Azure portal menu, select All services. In the list of resources, type Storage Accounts. As you begin typing, the list filters based on your input. Select
Storage Accounts.
2. On the Storage Accounts window that appears, choose Add.
3. Select the subscription in which to create the storage account.
4. Under the Resource group field, select RG1lod123456789
5. Next, enter a name for your storage account named: az400lod123456789stor
6. Select Create.
Step 2: Enable boot diagnostics on existing virtual machine
To enable Boot diagnostics on an existing virtual machine, follow these steps:
1. Sign in to the Azure portal, and then select the virtual machine VM1.
2. In the Support + troubleshooting section, select Boot diagnostics, then select the Settings tab.
3. In Boot diagnostics settings, change the status to On, and from the Storage account drop-down list, select the storage account az400lod123456789stor.
4. Save the change.
AZ-400_58E.png related to the Microsoft AZ-400 Exam
You must restart the virtual machine for the change to take effect.
Reference:
https://docs.microsoft.com/en-us/azure/storage/common/storage-account-create
https://docs.microsoft.com/en-us/azure/virtual-machines/troubleshooting/boot-diagnostics
Question 59
SIMULATION -
You have a web app that connects to an Azure SQL Database named db1.
You need to configure db1 to send Query Store runtime statistics to Azure Log Analytics.
To complete this task, sign in to the Microsoft Azure portal.
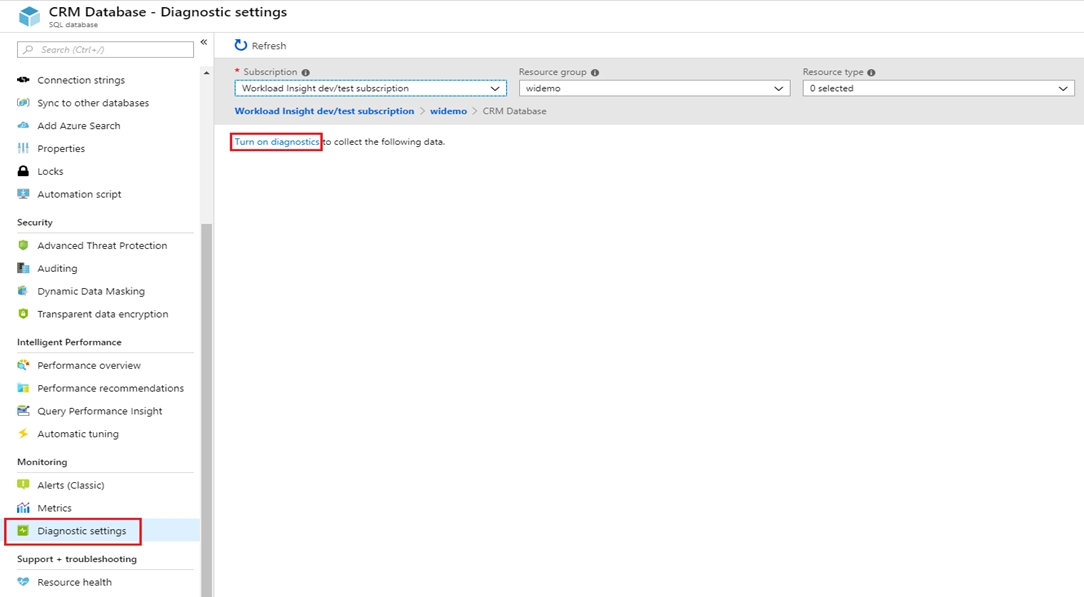
To enable streaming of diagnostic telemetry for a single or a pooled database, follow these steps:
1. Go to Azure SQL database resource.
2. Select Diagnostics settings.
3. Select Turn on diagnostics if no previous settings exist, or select Edit setting to edit a previous setting. You can create up to three parallel connections to stream diagnostic telemetry.
4. Select Add diagnostic setting to configure parallel streaming of diagnostics data to multiple resources.
AZ-400_59E_1.png related to the Microsoft AZ-400 Exam
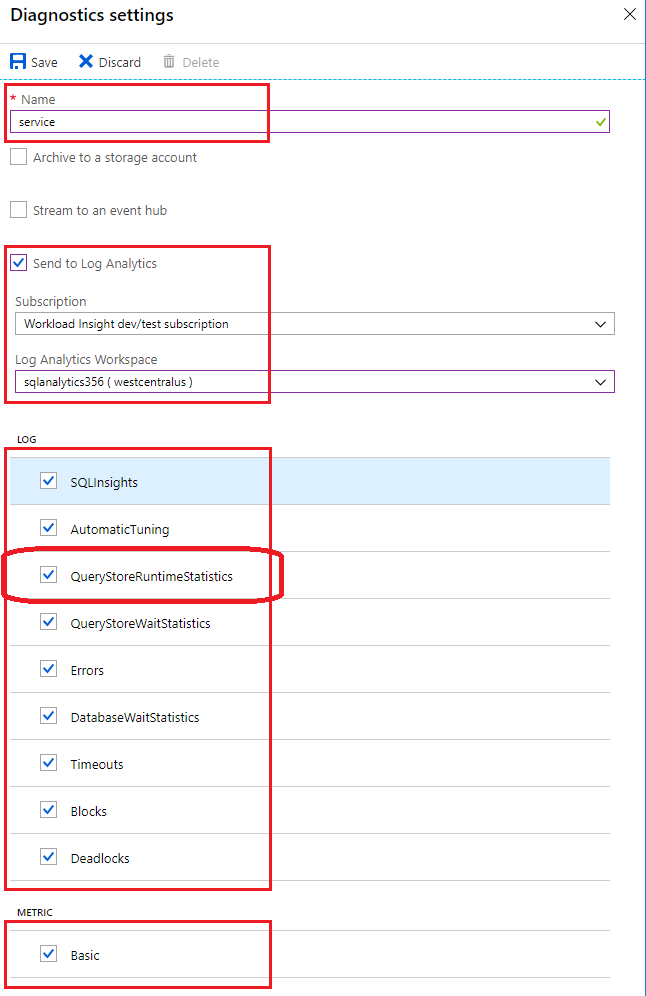
5. Enter a setting name for your own reference.
6. Select a destination resource for the streaming diagnostics data: Archive to storage account, Stream to an event hub, or Send to Log Analytics.
7. For the standard, event-based monitoring experience, select the following check boxes for database diagnostics log telemetry: QueryStoreRuntimeStatistics
AZ-400_59E_2.png related to the Microsoft AZ-400 Exam
8. For an advanced, one-minute-based monitoring experience, select the check box for Basic metrics.
9. Select Save.
Reference:
https://docs.microsoft.com/en-us/azure/azure-sql/database/metrics-diagnostic-telemetry-logging-streaming-export-configure

Question 60
DRAG DROP -
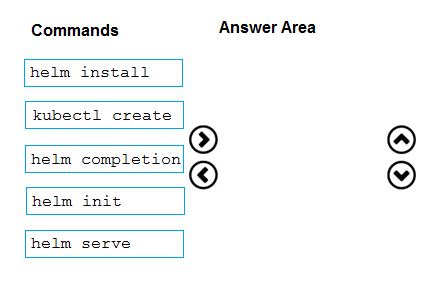
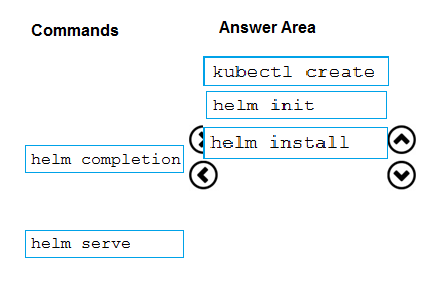
You need to recommend a solution for deploying charts by using Helm and Tiller to Azure Kubernetes Service (AKS) in an RBAC-enabled cluster.
Which three commands should you recommend be run in sequence? To answer, move the appropriate commands from the list of commands to the answer area and arrange them in the correct order.
Select and Place:
AZ-400_60Q.png related to the Microsoft AZ-400 Exam
Image AZ-400_60R.png related to the Microsoft AZ-400 Exam
Step 1: Kubectl create -
You can add a service account to Tiller using the --service-account <NAME> flag while you're configuring Helm (step 2 below). As a prerequisite, you'll have to create a role binding which specifies a role and a service account name that have been set up in advance.
Example: Service account with cluster-admin role
$ kubectl create -f rbac-config.yaml
serviceaccount "tiller" created
clusterrolebinding "tiller" created
$ helm init --service-account tiller
Step 2: helm init -
To deploy a basic Tiller into an AKS cluster, use the helm init command.
Step 3: helm install -
To install charts with Helm, use the helm install command and specify the name of the chart to install.
References:
https://docs.microsoft.com/en-us/azure/aks/kubernetes-helm
https://docs.helm.sh/using_helm/#tiller-namespaces-and-rbac