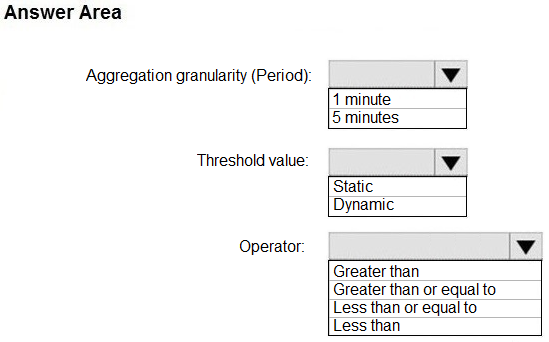
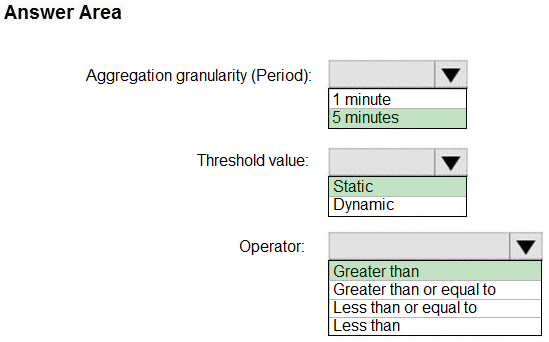
Box 1: 5 minutes -
The alert must calculate the average once every minute.
Note: We [Microsoft] recommend choosing an Aggregation granularity (Period) that is larger than the Frequency of evaluation, to reduce the likelihood of missing the first evaluation of added time series
Box 2: Static -
Box 3: Greater than -
Example, say you have an App Service plan for your website. You want to monitor CPU usage on multiple instances running your web site/app. You can do that using a metric alert rule as follows:
- Target resource: myAppServicePlan
- Metric: Percentage CPU
- Condition Type: Static
- Dimensions
- Instance = InstanceName1, InstanceName2
- Time Aggregation: Average
- Period: Over the last 5 mins
- Frequency: 1 min
- Operator: GreaterThan
- Threshold: 70
- Like before, this rule monitors if the average CPU usage for the last 5 minutes exceeds 70%.
- Aggregation granularity
Reference:
https://docs.microsoft.com/en-us/azure/azure-monitor/platform/alerts-metric-overview