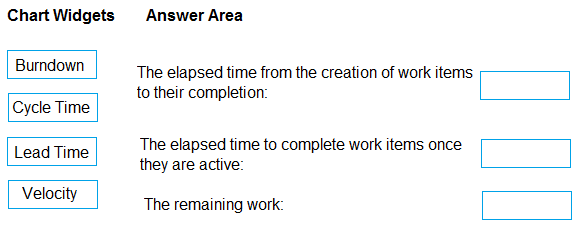
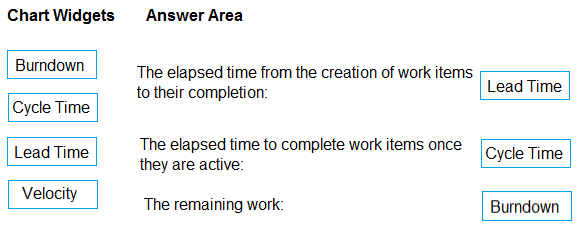
Box 1: Lead time -
Lead time measures the total time elapsed from the creation of work items to their completion.
Box 2: Cycle time -
Cycle time measures the time it takes for your team to complete work items once they begin actively working on them.
Box 3: Burndown -
Burndown charts focus on remaining work within a specific time period.
Incorrect Answers:
Velocity provides a useful metric for these activities:
Support sprint planning -
Forecast future sprints and the backlog items that can be completed
A guide for determining how well the team estimates and meets their planned commitments
Reference:
https://docs.microsoft.com/en-us/azure/devops/report/dashboards/velocity-guidance?view=vsts https://docs.microsoft.com/en-us/azure/devops/report/dashboards/cycle-time-and-lead-time?view=vsts https://docs.microsoft.com/en-us/azure/devops/report/dashboards/configure-burndown-burnup-widgets?view=vsts