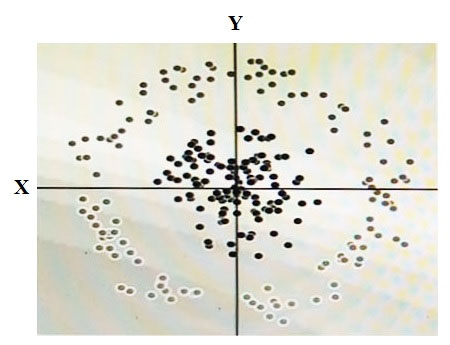
You have some data, which is shown in the graphic below. The two dimensions are X and Y, and the shade of each dot represents what class it is. You want to classify this data accurately using a linear algorithm. To do this you need to add a synthetic feature. What should the value of that feature be?